SunPower Solar Hacking

Let's man-in-the-middle the traffic

January 01, 2017By: Eric Hampshire
Finally got the SunPower PV monitor hooked up.  Now, onto the hacking!

First up, I needed to "force" the PV monitor to talk over it's powerline module.  I had it forget my wireless network by plugging into the PV monitor's setup port and stepping through the setup until I got to the network connectivity settings.

Now, I needed to buy a switch that would let me mirror a port so I could "man-in-the-middle" the traffic from the powerline module to the SunPower portal.  I bought this one.  I then mirrored the traffic from the port the powerline module was plugged into TO the port my BeagleBone Black was plugged into.  That told the switch to mirror all the traffic the powerline was sending to the BeagleBone Black.

I had a BeagleBone Black lying around, so I decided to use that to sniff the traffic.  You could easily do this with a Raspberry Pi instead, but something running some form of Linux is advisable.  Install tcpdump and libpcap so that you can do some sanity checking on the data coming across the line.  You don't want to see all the traffic, so you need to filter by either the source IP (of the PV monitor) or the destination (of the SunPower portal site).  Here's an example of both ways:

# IP of PV Monitor   
tcpdump -w /mnt/mydrive/sp-pkts2.pcap -U -i eth0 'ip && tcp && src 10.0.1.139'  

# collector.sunpowermonitor.com  
tcpdump -w /mnt/mydrive/sp-pkts2.pcap -U -i eth0 'ip && tcp && dst net 204.194.111.66'

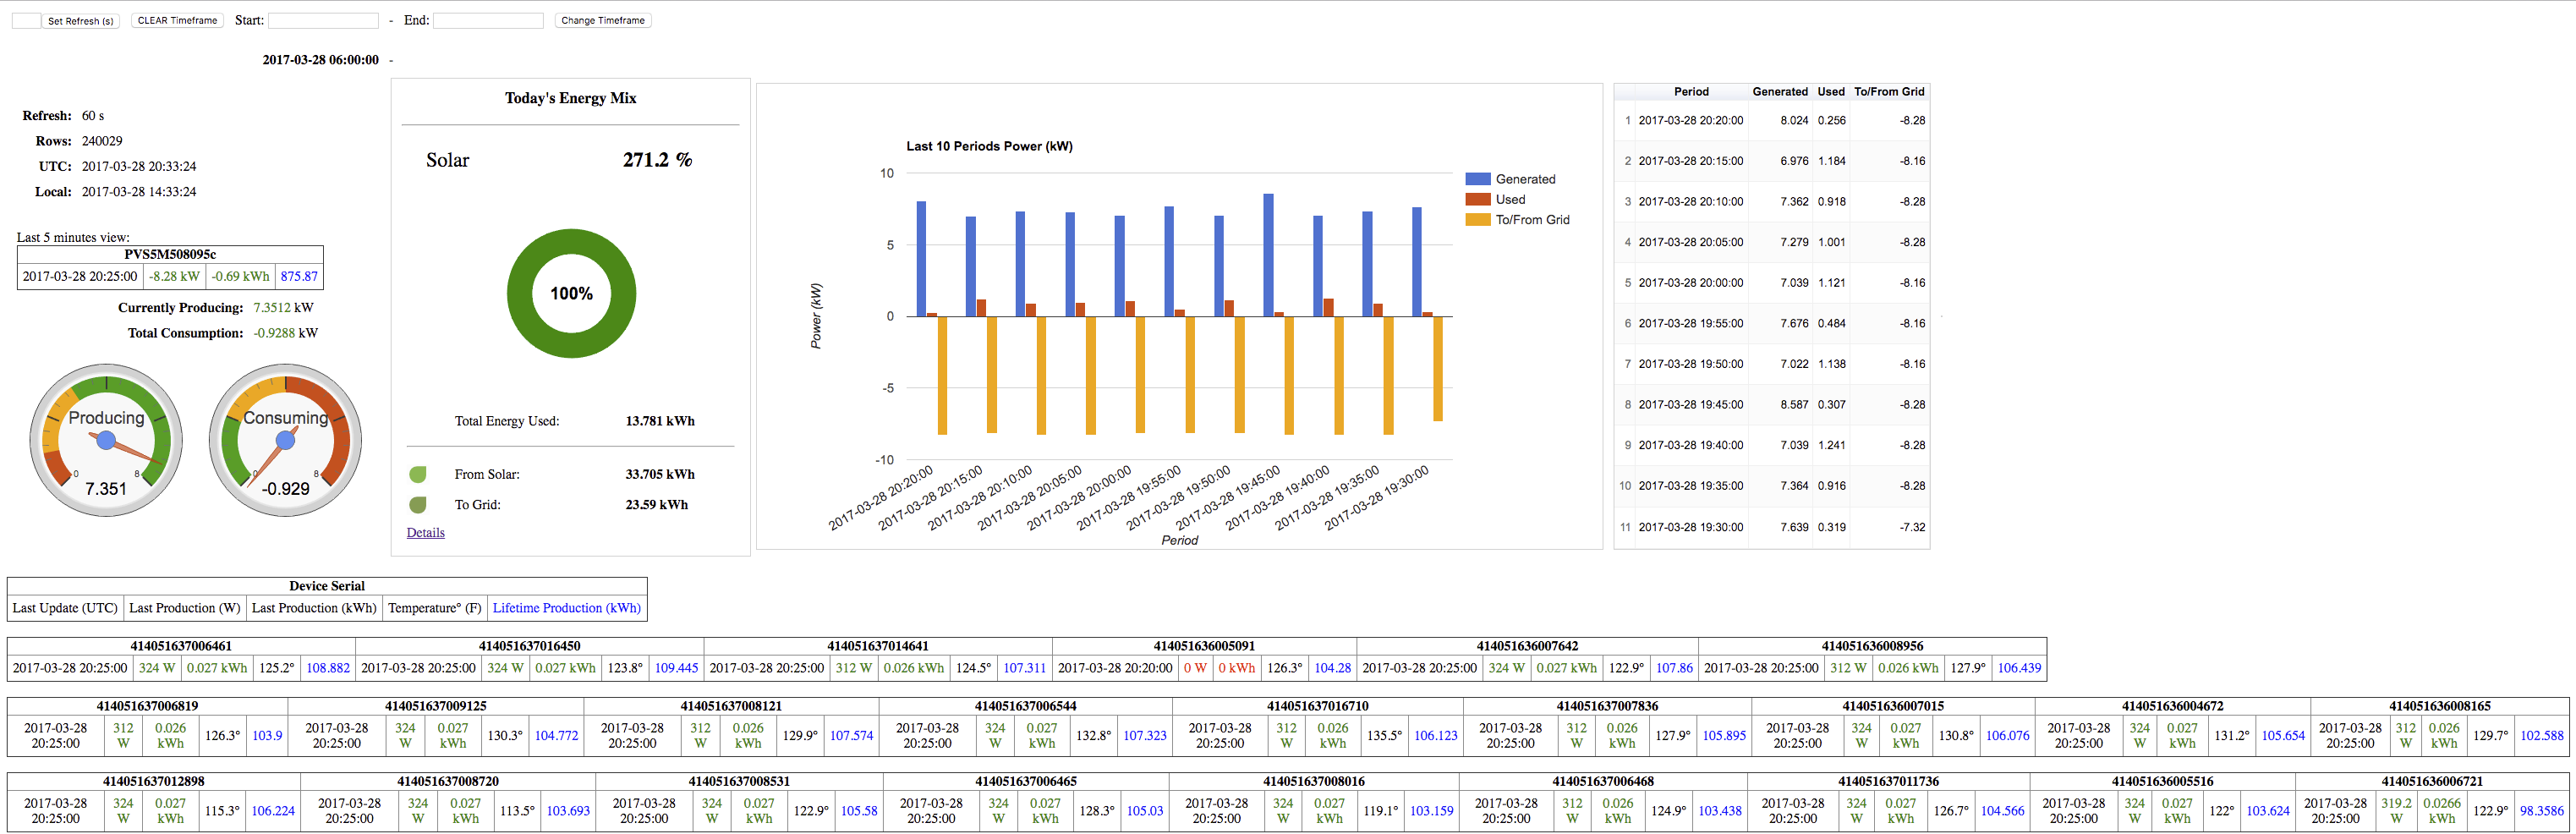
Doing a "tail -f" of the log files specified with the "-w" command should show some traffic coming across the line.  Every 5 minutes the SunPower PV monitor will report the power generated and consumed.  I captured the traffic for 10 or 15 minutes and then loaded the packet capture file into WireShark to make it easy to find the data I was interested in.

Tcpdump breakdown

Above you see a screen shot from WireShark following the TCP stream we are interested in!  Let's break that down...

The first column represents the message type.  The only ones we will care about are "130" and "140".  The other message types are 100 (control message), 102 (checksum message) and 141/120 (unknown).  The second column is the UTC timestamp of the message.  You will note this timestamp changes by 5 minutes every time the PV monitor reports.  The third column is the serial number of the device reporting.  In my case, my PV monitor has the serial "PVS5M508095c".  This is an important value to note as it will be used throughout the scripts that drive our portal.  The fourth column is a description of the device reporting.  Finally, the fifth column is the total watts either produced or consumed for the lifetime of the device reporting.

The lines that begin with "130" are entries where my microinverters are reporting their production for the last 5 minutes.  Since each of my 24 panels have a microinverter in them, they each report individually.  If you have a string inverter I believe you will only see one (1) "130" line every 5 minutes showing what your panels produced in aggregate.

The lines that begin with "140" are the consuming reporting.  These entries are actually the PV monitor reporting what it is seeing coming across the power main.

You might note that the column we care about is the 5th column, but it is showing the lifetime watts for the device.  In the case of the panels, it's showing the lifetime power (in kW) that have been generated by that panel.  That means, to know how much power that device generated over the last 5 minutes, we actually have to do math and subtract from the previously reported 5 minute value.  Ugh!

How did I figure this out?  Well, this thread was supremely helpful.  Turns out I'm not the first nerd to hack his solar panels and get at the data.  Thanks to that thread, I was also able to determine the third-to-last column represents the temperature of the microinverter in degrees Celsius.

Get the RAW data into a DB!

Now we're down to the coding.  If you want to follow along you're going to need all the tools/scripts I've written.  You can grab everything from GitHub here.

https://github.com/ehampshire/sunpower/tree/dev

So, you'll find in the "capture" directory a couple utilities.  "sunpower.pl" was the Perl script I originally wrote to log the traffic to a file.  I'm not great at Perl so I switched to Python and wrote "pycap.py".  This Python script will capture the traffic (printing to the console), write to a log file, and load the data directly into a Mysql DB.  Before running it, I'd recommend setting up your Mysql DB with the "solar.sql" file from the "db" directory.  This will setup the appropriate DB (called simply "solar") and the tables needed (sp_raw_production, sp_power, sp_energy).  

There is a "pycap.conf" file you will want to edit to provide things like DB credentials and where to write the log files.  "db_loader.py" is a standalone log file loader that will take either pcap files from tcpdump or log files written by "pycap.py".  "monitor.sh" is a bash shell script that I run every 5 minutes on a cron that will ensure "pycap.py" is running and roll the log files daily.

Once you have "pycap.py" running for awhile you should see raw data start to appear in the table "sp_raw_production" inside the "solar" db of your Mysql instance.  You can either view this data in the DB or check out the log file written by "pycap.py".  To find the amount of power (in kW) a module is generating, subtract the previous value (in column 5) from the last value.

Let's make it pretty!

February 25, 2017By: Eric Hampshire
The screenshot above is what my system looks like in the middle of a typical, sunny day.  You can also view a full-size image here.

The grid at the bottom shows the actual layout of my solar panels.  I have a row of 6 across the top (in landscape) and 2 rows of 9 (portrait) below them.  I mapped their location by calling the SunPower APIs directly using the project here.

I included some examples of how to use these APIs in the "web" directory of my Sunpower github project.  First, use "auth.sh" to authenticate to the SunPower portal, replacing username and password with yours.  Then, take the tokenID you receive back and put that on the end of the curl command (replacing the one that's there) in "getModuleInfo.sh".  Finally, take the output from that script and put it into the "data" variable of "pretty_json.py" to print things out nicely.  This will show you all kinds of info about your modules, but you will want to know the X and Y coordinates in particular for building the layout (in the "vars.php" file).

Take the "web" directory from the SunPower github project and put it on a web server that can run PHP pages.  Make sure to edit the "vars.php" to include details of your MySQL DB, PV monitor serial number, timezone, and layout of your solar panels.  You can find the layout following the directions in the above paragraph.

Finally, load up "index.php" in your browser.  To get historical data you will want to enable a cron to run the "db/solar_analysis.py" every 5 minutes or so.  This will analyze the "sp_raw_production" table to fill in the "sp_power" and "sp_energy" tables.  The Python script has a config file called "db/solar_analysis.conf" that you will need to use to configure your MySQL credentials.  I use the Google Charts APIs for creating all the pretty graphics, so your web page will be loading those from the external, google site.